

As a supplier of 3 - Bromobenzaldehyde, I've had the privilege of delving deep into the properties and analytical aspects of this compound. One of the most powerful tools in understanding 3 - Bromobenzaldehyde is infrared (IR) spectroscopy. In this blog, I'll explore the wealth of information that can be gleaned from the IR spectrum of 3 - Bromobenzaldehyde.
Understanding the Basics of IR Spectroscopy
Infrared spectroscopy is a technique that measures the absorption of infrared radiation by a molecule. Different functional groups in a molecule absorb infrared radiation at characteristic frequencies, which are determined by the types of bonds present and their vibrational modes. When a molecule absorbs infrared radiation, it causes the bonds within the molecule to vibrate in specific ways, such as stretching and bending. By analyzing the absorption peaks in an IR spectrum, we can identify the functional groups present in the molecule.
Key Functional Groups in 3 - Bromobenzaldehyde and Their IR Signatures
Aromatic Ring
3 - Bromobenzaldehyde contains an aromatic benzene ring. Aromatic rings exhibit several characteristic absorption peaks in the IR spectrum. The C - H stretching vibrations of the aromatic ring typically occur in the range of 3030 - 3100 cm⁻¹. These peaks are relatively sharp and are a good indicator of the presence of an aromatic system.

The C = C stretching vibrations of the aromatic ring are observed in the region of 1450 - 1600 cm⁻¹. Multiple peaks in this range are due to the different vibrational modes of the carbon - carbon double bonds in the benzene ring. The pattern of these peaks can provide information about the substitution pattern on the aromatic ring. For 3 - Bromobenzaldehyde, the specific substitution pattern will influence the exact frequencies and intensities of these peaks.
Aldehyde Group
The aldehyde functional group (-CHO) in 3 - Bromobenzaldehyde gives rise to two prominent absorption peaks. The C = O stretching vibration of the aldehyde group occurs around 1690 - 1740 cm⁻¹. This peak is usually very strong and is one of the most characteristic features in the IR spectrum of an aldehyde. The relatively low frequency of the C = O stretch in aldehydes compared to some other carbonyl - containing compounds is due to resonance effects.
The C - H stretching vibration of the aldehyde hydrogen (the hydrogen directly attached to the carbonyl carbon) is observed in the range of 2720 - 2820 cm⁻¹. This peak is often a doublet, which is a unique characteristic of aldehydes. The presence of this doublet, along with the strong C = O stretch, is a clear indication of the presence of an aldehyde group in the molecule.
Carbon - Bromine Bond
The C - Br bond in 3 - Bromobenzaldehyde has an absorption peak in the IR spectrum. The C - Br stretching vibration typically occurs in the range of 500 - 600 cm⁻¹. This peak is relatively broad and is a useful marker for the presence of a carbon - bromine bond in the molecule. The exact frequency of the C - Br stretch can be influenced by factors such as the hybridization of the carbon atom to which the bromine is attached and the overall molecular environment.
Analyzing the Substitution Pattern
The IR spectrum can also provide some information about the substitution pattern on the aromatic ring. In the case of 3 - Bromobenzaldehyde, the presence of the bromine and aldehyde groups at specific positions on the benzene ring can affect the frequencies and intensities of the aromatic C - H and C = C stretching vibrations.
For example, the electron - withdrawing or electron - donating nature of the substituents can influence the electron density in the aromatic ring, which in turn affects the bond strengths and vibrational frequencies. The aldehyde group is an electron - withdrawing group, and the bromine atom also has some electron - withdrawing properties. These effects can cause shifts in the characteristic absorption peaks of the aromatic ring compared to an unsubstituted benzene ring.
Comparing with Similar Compounds
It's interesting to compare the IR spectrum of 3 - Bromobenzaldehyde with those of similar compounds. For instance, 4 - Bromophenethyl Alcohol has a different functional group compared to 3 - Bromobenzaldehyde. The presence of an alcohol group (-OH) in 4 - Bromophenethyl Alcohol will result in a broad absorption peak in the range of 3200 - 3600 cm⁻¹ due to the O - H stretching vibration. This peak is absent in the IR spectrum of 3 - Bromobenzaldehyde.
Another compound for comparison is Dicyandiamide 10 Micron Superfine. Dicyandiamide has a completely different molecular structure and functional groups. Its IR spectrum will show characteristic peaks related to its cyanamide and amine functional groups, which are very different from the peaks observed in the IR spectrum of 3 - Bromobenzaldehyde.
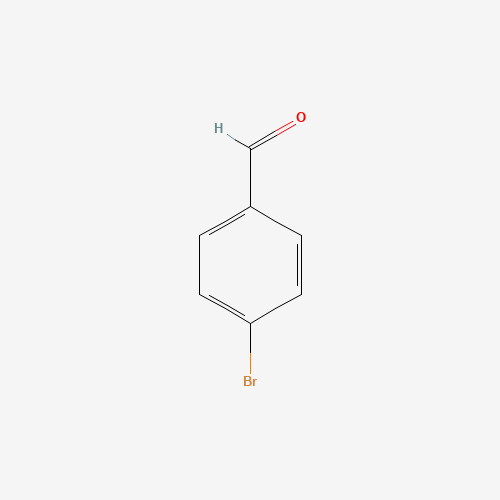
P - Bromobenzaldehyde is a structural isomer of 3 - Bromobenzaldehyde. While both compounds have a bromine atom and an aldehyde group attached to a benzene ring, the different substitution patterns will result in some differences in their IR spectra. The relative positions of the substituents can affect the symmetry of the molecule and the interactions between the functional groups and the aromatic ring, leading to variations in the frequencies and intensities of the absorption peaks.
Importance for Quality Control
As a supplier of 3 - Bromobenzaldehyde, the IR spectrum is an invaluable tool for quality control. By comparing the IR spectrum of a sample of 3 - Bromobenzaldehyde with a reference spectrum, we can ensure that the product has the correct chemical structure and is free from significant impurities. Any unexpected peaks in the IR spectrum could indicate the presence of contaminants or by - products in the sample.
For example, if there is an additional peak in the region where the O - H stretching vibration is expected, it could suggest the presence of an alcohol impurity. Similarly, if the characteristic peaks of the aldehyde group or the C - Br bond are missing or have abnormal intensities, it could indicate a problem with the synthesis or purification process.
Conclusion
In conclusion, the IR spectrum of 3 - Bromobenzaldehyde provides a wealth of information about its chemical structure. From the identification of functional groups such as the aromatic ring, aldehyde group, and carbon - bromine bond to the analysis of the substitution pattern on the aromatic ring, IR spectroscopy is a powerful tool for understanding this compound.
As a supplier, we rely on the information from the IR spectrum to ensure the quality and purity of our 3 - Bromobenzaldehyde products. If you are in the market for high - quality 3 - Bromobenzaldehyde or have any questions about its properties and applications, we encourage you to contact us for a procurement discussion. We are committed to providing you with the best products and services.
References
- Silverstein, R. M., Webster, F. X., & Kiemle, D. J. (2014). Spectrometric Identification of Organic Compounds. Wiley.
- Pavia, D. L., Lampman, G. M., Kriz, G. S., & Engel, R. G. (2009). Introduction to Spectroscopy. Brooks/Cole.